One for AllOne for All (OFA) - Complete ICT Analysis Suite
Version 3.3.0 by theCodeman
📊 Overview
One for All (OFA) is a comprehensive TradingView indicator designed for traders who follow Inner Circle Trader (ICT) concepts. This all-in-one tool combines essential ICT analysis features—sessions, kill zones, previous period levels, and higher timeframe candles with Fair Value Gaps (FVGs) and Volume Imbalances (VIs)—into a single, highly customizable indicator. Whether you're a beginner learning ICT concepts or an experienced trader refining your edge, OFA provides the visual structure needed for precise market analysis and execution.
✨ Key Features
- 🏷️ Customizable Watermark**: Display your trading identity with customizable titles, subtitles, symbol info, and full style control
- 🌍 Trading Sessions**: Visualize Asian, London, and New York sessions with high/low lines, range boxes, and open/close markers
- 🎯 Kill Zones**: Highlight 5 critical ICT kill zones with precise timing and visual boxes
- 📈 Previous Period H/L**: Track Daily, Weekly, and Monthly highs/lows with customizable styles and lookback periods
- 🕐 Higher Timeframe Candles**: Display up to 5 HTF timeframes with OHLC trace lines, timers, and interval labels
- 🔍 FVG & VI Detection**: Automatically detect and visualize Fair Value Gaps and Volume Imbalances on HTF candles
- ⚙️ Universal Timezone Support**: Works globally with GMT-12 to GMT+14 timezone selection
- 🎨 Full Customization**: Control colors, styles, visibility, and layout for every feature
🚀 How to Use
Watermark Setup
The watermark overlay helps you identify your charts and maintain focus on your trading principles:
1. Enable/disable watermark via "Show Watermark" toggle
2. Customize the title (default: "Name") to display your trading name or account identifier
3. Set up to 3 subtitles (default: "Patience", "Confidence", "Execution") as trading reminders
4. Choose position (9 locations available), size, color, and transparency
5. Toggle symbol and timeframe display as needed
Use Case: Display your trading principles or account name for multi-monitor setups or content creation.
Trading Sessions Analysis
Sessions define market character and liquidity availability:
1. Enable "Show All Sessions" to visualize all three sessions
2. Adjust timezone to match your local market (default: UTC-5 for EST)
3. Customize session times if needed (defaults cover standard hours)
4. Enable session range boxes to see consolidation zones
5. Use session high/low lines to identify key levels for the current session
6. Enable open/close markers to track session transitions
Use Case: Identify which session you're trading in, track session highs/lows for liquidity, and anticipate session transition volatility.
Kill Zones Trading
Kill zones are ICT's high-probability trading windows:
1. Enable individual kill zones or use "Show All Kill Zones"
2. **Asian Kill Zone** (2000-0000 GMT): Early positioning and smart money accumulation
3. **London Kill Zone** (0300-0500 GMT): European market opening volatility
4. **NY AM Kill Zone** (0930-1100 EST): Post-NYSE open expansion
5. **NY Lunch Kill Zone** (1200-1300 EST): Midday consolidation or manipulation
6. **NY PM Kill Zone** (1330-1600 EST): Afternoon positioning and closes
7. Customize colors and times to match your trading style
8. Set max days display to control historical visibility (default: 30 days)
Use Case: Focus entries during high-probability windows. Watch for liquidity sweeps at kill zone openings and institutional positioning.
Previous Period High/Low Levels
Previous period levels act as magnetic price targets and support/resistance:
1. Enable Daily (PDH/PDL), Weekly (PWH/PWL), or Monthly (PMH/PML) levels individually
2. Set lookback period (how many previous periods to display)
3. Choose line style: Solid (current emphasis), Dashed (standard), or Dotted (subtle)
4. Customize colors per timeframe for visual hierarchy
5. Adjust line width (1-5) for visibility preference
6. Enable gradient effect to fade older periods
7. Position labels left or right based on chart layout
8. Customize label text for your preferred notation
Use Case: Identify key levels where price is likely to react. Daily levels work on intraday timeframes, Weekly on daily charts, Monthly for swing trading.
Higher Timeframe (HTF) Candles
HTF candles reveal the larger market context while trading lower timeframes:
1. Enable up to 5 HTF slots simultaneously (default: 5m, 15m, 1H, 4H, Daily)
2. Choose display mode: "Below Chart" (stacked rows) or "Right Side" (compact column)
3. Customize timeframe, colors (bull/bear), and titles for each slot
4. **OHLC Trace Lines**: Visual lines connecting HTF candle levels to chart bars
5. **HTF Timer**: Countdown showing time remaining until HTF candle close
6. **Interval Labels**: Display day of week (Daily+) or time (intraday) on each candle
7. For Daily candles: Choose open time (Midnight, 8:30, 9:30) to match your market structure preference
Use Case: Trade lower timeframes while respecting higher timeframe structure. Watch for HTF candle closes to confirm directional bias.
FVG & VI Detection
Fair Value Gaps and Volume Imbalances highlight inefficiencies that price often revisits:
1. **Fair Value Gaps (FVGs)**: Detected when HTF candle wicks don't overlap between 3 consecutive candles
- Bullish FVG: Gap between candle 1 high and candle 3 low (green box by default)
- Bearish FVG: Gap between candle 1 low and candle 3 high (red box by default)
2. **Volume Imbalances (VIs)**: Similar detection but focuses on body gaps
- Bullish VI: Gap between candle 1 close and candle 3 open
- Bearish VI: Gap between candle 1 open and candle 3 close
3. Enable FVG/VI detection per HTF slot individually
4. Customize colors and transparency for each imbalance type
5. Boxes appear on chart at formation and remain visible as retracement targets
**Use Case**: Identify high-probability retracement zones. Price often returns to fill FVGs and VIs before continuing the trend. Use as entry zones or profit targets.
🎨 Customization
OFA is built for flexibility. Every feature includes extensive customization options:
Visual Customization
- **Colors**: Independent color control for every element (sessions, kill zones, lines, labels, FVGs, VIs)
- **Transparency**: Adjust box and label transparency (0-100%) for clean charts
- **Line Styles**: Choose Solid, Dashed, or Dotted for previous period lines
- **Sizes**: Control text size, line width, and box borders
- **Positions**: Place watermark in 9 positions, labels left/right
Layout Control
- **HTF Display Mode**: "Below Chart" for detailed analysis, "Right Side" for space efficiency
- **Drawing Limits**: Set max days for sessions/kill zones to manage chart clutter
- **Lookback Periods**: Control how many previous periods to display (1-10)
- **Gradient Effects**: Enable fading for older previous period lines
Timing Adjustments
- **Timezone**: Universal GMT offset selector (-12 to +14) for global markets
- **Session Times**: Customize each session's start/end times
- **Kill Zone Times**: Adjust kill zone windows to match your market's characteristics
- **Daily Open**: Choose Midnight, 8:30, or 9:30 for Daily HTF candle open time
💡 Best Practices
1. Start Simple: Enable one feature at a time to learn how each element affects your analysis
2. Match Your Timeframe: Use Daily levels on intraday charts, Weekly on daily charts, HTF candles one or two levels above your trading timeframe
3. Kill Zone Focus: Concentrate your trading activity during kill zones for higher probability setups
4. HTF Confirmation: Wait for HTF candle closes before committing to directional bias
5. FVG/VI Entries: Look for price to return to unfilled FVGs/VIs for entry opportunities with favorable risk/reward
6. Customize Colors: Use a consistent color scheme that matches your chart theme and reduces visual fatigue
7. Reduce Clutter: Disable features you're not actively using in your current trading plan
8. Session Context: Understand which session controls the market—trade with session direction or anticipate reversals at session transitions
⚙️ Settings Guide
OFA organizes settings into logical groups for easy navigation:
- **═══ WATERMARK ═══**: Title, subtitles, position, style, symbol/timeframe display
- **═══ SESSIONS ═══**: Enable/disable sessions, times, colors, high/low lines, boxes, markers
- **═══ KILL ZONES ═══**: Individual kill zone toggles, times, colors, max days display
- **═══ PREVIOUS H/L - DAILY ═══**: Daily high/low lines, style, color, lookback, labels
- **═══ PREVIOUS H/L - WEEKLY ═══**: Weekly high/low lines, style, color, lookback, labels
- **═══ PREVIOUS H/L - MONTHLY ═══**: Monthly high/low lines, style, color, lookback, labels
- **═══ HTF CANDLES ═══**: Global display mode, layout settings
- **═══ HTF SLOT 1-5 ═══**: Individual HTF configuration (timeframe, colors, title, FVG/VI detection, trace lines, timer, interval labels)
Each setting includes tooltips explaining its function. Hover over any input for detailed guidance.
📝 Final Notes
One for All (OFA) represents a complete ICT analysis toolkit in a single indicator. By combining watermark customization, session visualization, kill zone highlighting, previous period levels, and higher timeframe candles with FVG/VI detection, OFA eliminates the need for multiple indicators cluttering your chart.
**Version**: 3.3.0
**Author**: theCodeman
**Pine Script**: v6
**License**: Mozilla Public License 2.0
Start with default settings to learn the indicator's structure, then customize extensively to match your personal trading style. Remember: tools provide information, but your edge comes from disciplined execution of a proven strategy.
Happy Trading! 📈
在腳本中搜尋"smart money"

BTC - VERI - Valuation & Entity Ratio IndexVERI: Valuation & Entity Ratio IndexObservation-only.
Data: IntoTheBlock.
Overview & Philosophy
The name VERI is derived from the Latin Veritas (Truth). In a crypto market often driven by deceptive speculative noise, this indicator seeks to establish the "On-Chain Truth" of a price trend.
It operates on the thesis that price action is only sustainable when verified by high-conviction capital flows.VERI is a fundamental composite oscillator that fuses Entity Behavior (Who is holding?) with Network Valuation (Is the price fair?) to identify Bitcoin market cycle extremes.
The "Alpha"
Why this Composite stands out: on-chain metrics often tell only half the story.
MVRV tells you if the price is cheap, but not if anyone is actually buying.
Whale Activity tells you if large players are moving, but not if they are accumulating at a value discount.
VERI fuses these two dimensions into a single Z-Score. It identifies the rare, high-probability moments where Smart Money Conviction intersects with Deep Value.
Methodology
The Mathematics of VERI: The indicator constructs a composite index using three fundamental metrics from IntoTheBlock:
The "Who" (Entity Ratio) : We calculate the flow ratio between Whales (>1% supply holders) and Retail (<0.1% supply holders). A rising ratio indicates supply is transferring from weak hands to strong hands.
The "Why" (Valuation Multiplier) : We utilize the MVRV (Market Value to Realized Value) ratio. To isolate value opportunities, we use the inverse (1 / MVRV).
The Fusion : These factors are multiplied to create the raw VERI index.
Normalization & Inversion
We apply a rolling Z-Score (standard deviation from the mean) and invert the result.
How to Interpret the Indicator
Because the output is inverted, the visual logic matches price action intuitively:
🟥 Distribution Zone (High Values > 1.5):
The Signal: "Low Conviction Overvaluation."
Context: The price is historically expensive relative to the cost basis (High MVRV), and Whales are distributing coins to Retail.Implication: Historically precedes macro tops or deep corrections.
🟩 Accumulation Zone (Low Values < -1.5):
The Signal: "High Conviction Undervaluation."Context: The price is historically cheap (Low MVRV), and Whales are aggressively accumulating relative to Retail.
Implication: Historically precedes macro bottoms and generational entry points.
Zero Line : Represents the historical baseline. A crossover of the zero line often confirms a regime shift (e.g., from Bear to Bull).
Visual Guide & Features
Dynamic Coloring: The line turns Red in the Distribution Zone, Blue in the Accumulation Zone, and Orange during neutral trends.
Zone Labels: Static labels are pinned to the left side of the chart for immediate context.
The "Data Check" Monitor (Status Table): Since this indicator relies on third-party fundamental data, we have included a diagnostic table in the bottom-right corner.
Data Check Monitor Guide
STATUS: LIVE (Green): The indicator is functioning correctly. All data feeds (Whales, Retail, MVRV) are being retrieved successfully.
STATUS: WAIT (Red): The indicator cannot retrieve data. This might happen for some reasons, e.g. your TradingView plan may not support IntoTheBlock integration.
Settings
Lookback Period (Default: 365): The window used for Z-Score normalization. We use a full year to smooth out seasonal volatility.
Smoothing (Default: 7): A 7-day smoothing is applied to the signal to filter out daily noise.
Zone Thresholds: Users can customize the specific Z-Score levels for the Distribution and Accumulation bands.
Disclaimer
This script is for research and educational purposes only. It uses historical on-chain data to visualize market structure and does not constitute financial advice. Past performance of whale entities does not guarantee future results.
Tags
bitcoin, btc, on-chain, mvrv, whales, valuation, fundamentals, cycle, oscillator, veri

Macros+AMD [NW]Macros + AMD - Daily & Weekly Time-Based Analysis
Multi-timeframe AMD (Accumulation, Manipulation, Distribution) visualization with ICT Macro timing windows for time-based market analysis.
Overview
This indicator visualizes the AMD (Accumulation, Manipulation, Distribution) framework on both daily and weekly timeframes, combined with ICT Macro timing windows. It is designed as an educational tool to help traders study time-based market structure and algorithmic price delivery concepts.
The AMD model is based on the idea that markets move through distinct phases within each trading period:
Accumulation (A) - Initial range formation, liquidity building
Manipulation (M) - False moves to trap traders, liquidity sweeps
Distribution (D) - True directional move, price delivery to targets
What This Indicator Displays
Daily AMD Phases
Displays the intraday AMD cycle based on New York trading hours:
A Phase (Blue): 4:00 AM - 8:35 AM EST — Morning accumulation, Asian/London overlap
M Phase (Red): 8:35 AM - 11:25 AM EST — NY session manipulation, news events
D Phase (Green): 11:25 AM - 4:00 PM EST — Afternoon distribution and price delivery
Weekly AMD Phases
Displays the weekly AMD cycle from Monday to Monday:
A Phase: Monday 00:00 - Tuesday 21:56 EST — Weekly high/low formation begins
M Phase: Tuesday 21:56 - Thursday 02:04 EST — Mid-week reversal zone
D Phase: Thursday 02:04 - Monday 00:00 EST — Weekly price delivery
Inner M Phase Fibs
When enabled, subdivides the M (Manipulation) phase using Fibonacci levels:
0.382 level — Inner accumulation ends
0.500 level — Mid-point of manipulation
0.618 level — Inner distribution begins
This helps identify potential reversal points within the manipulation phase.
ICT Macro Windows
Horizontal lines marking the XX:42 to XX:15 macro periods (33-minute windows):
2:42 - 3:15 AM
3:42 - 4:15 AM (London)
7:42 - 8:15 AM
8:42 - 9:15 AM
9:42 - 10:15 AM (Prime AM session)
10:42 - 11:15 AM
11:42 - 12:15 PM
12:42 - 1:15 PM
1:42 - 2:15 PM
2:42 - 3:15 PM
These windows represent times when algorithmic price delivery is more likely to occur.
How To Use
Understanding the AMD Framework
During the A Phase:
Observe range formation and initial liquidity pools
Note the high and low established during this phase
Wait for manipulation before committing to direction
During the M Phase:
Watch for false breakouts and stop hunts
Look for reversal patterns after liquidity sweeps
The inner fibs (0.382, 0.5, 0.618) can help time entries within this phase
Mid-week (Wednesday) often sees key reversals on weekly AMD
During the D Phase:
This is typically when the true move occurs
Price tends to deliver toward draw on liquidity targets
The direction is often opposite to the manipulation move
Using the Macro Windows
The XX:42 to XX:15 windows are times to pay attention to price action:
These 33-minute periods often see increased algorithmic activity
Look for displacement, fair value gaps, or order blocks forming
The 9:42-10:15 AM window is considered particularly significant for NY session
Weekly Day Labels
Monday/Tuesday: "H/L of Week" — Watch for weekly high or low formation
Wednesday: "Reversal Day" — Mid-week reversal probability increases
Thursday/Friday: "Reversal Day" — Continuation or secondary reversal
Settings Guide
Main Settings
Timezone: Set to your broker's timezone or preferred timezone
Macros On Top: Toggle macro lines above or below AMD boxes
Show All Text Labels: Master toggle for all text (turn off for clean charts on HTF)
Daily/Weekly AMD
Show: Enable/disable the AMD visualization
Opacity: Adjust transparency of the phase boxes (higher = more transparent)
AMD Colors
Customize colors for each phase (A, M, D)
Default: Blue (A), Red (M), Green (D)
Inner M Style
Customize the inner M phase fib lines and text colors
Default: Black lines for clean visibility
Macro Settings
Adjust macro line color and thickness
Toggle individual macro windows on/off
Important Notes
This indicator is for educational purposes and time-based analysis
It does not provide buy/sell signals
Always use in conjunction with proper price action analysis
Past price behavior during these time windows does not guarantee future results
The AMD framework is one lens for viewing market structure — use it as part of a complete methodology
Credits
This indicator is based on concepts taught by ICT (Inner Circle Trader) and the broader Smart Money Concepts community. The AMD framework, macro timing windows, and weekly profile concepts are derived from this educational methodology.
Timeframe Recommendations
Best viewed on 1-minute to 15-minute charts
Text labels automatically hide on 9-minute and higher timeframes for cleaner visualization
Indicator hides completely on 1-hour and higher timeframes
Changelog
v1.0 - Initial release
Daily AMD phases (4am-4pm EST)
Weekly AMD phases (Monday-Monday)
Inner M phase Fibonacci subdivisions
10 ICT Macro timing windows
Full customization options
Automatic 9-day cleanup

NIFTY 5m/15m Smart Money CE/PE – High WinRatenice strategy for intraday NIFTY option trading. It works best on 5 minute time frame on NIFTY Index Chart

Pure FVG [Textbook]1. The Core Concept
This is not a standard "show all gaps" indicator. It is a specific entry signal generator based on Smart Money Concepts (SMC).
It focuses on Consequent Encroachment (The 50% Level). The underlying principle is that a Fair Value Gap (FVG) represents a market inefficiency where opposing traders are trapped. When price retraces at least 50% back into this gap, it creates pressure as these trapped positions look to exit—either through stop-losses or position reversal. This makes the gap most likely to act as a reversal zone.
2. How It Works (The Lifecycle)
The indicator logic follows a strict sequence of events. A signal is generated only if all conditions are met in order:
-- Phase 1: Identification (The Fresh Gap)
The script scans for the classic 3-candle FVG pattern (where the 1st and 3rd candles do not overlap).
Visual: It draws a box (Green for Bullish, Red for Bearish) extending to the right.
The 50% Line: A dashed line is drawn through the center of the gap.
-- Phase 2: Mitigation (The Gray Zone)
This is the critical filter. The indicator waits for a candle to CLOSE past the 50% dashed line.
Once this happens, the gap is considered "Deeply Mitigated."
Visual: The box changes color to Gray. This tells the trader: "Price is deep in the zone, watch for a reaction."
-- Phase 3: The Signal (Rejection)
Once the box is Gray, the script watches for a "Rejection Candle."
Bullish Scenario: Price is deep in the gap (Gray). The script waits for a candle to close higher than it opened (a green candle).
Bearish Scenario: Price is deep in the gap (Gray). The script waits for a candle to close lower than it opened (a red candle).
Visual: A Triangle Label (▲ or ▼) appears, signaling an entry.
-- Phase 4: Invalidation
If the price closes completely past the far edge of the box (the Stop Loss level), the box is deleted immediately.
3. Key Options
These are the most important settings for the user:
-- Min Gap Size (%):
Filters out "noise." It ensures the script ignores tiny, insignificant gaps that are less than X% in height.
-- Max Visible Gaps:
Keeps your chart clean. It limits how many open boxes can be on the screen at once (e.g., only show the last 3 unclosed gaps).
-- Show Signal History Only:
Feature Highlight: When enabled, this hides all the "noise" of open or failed gaps. It only draws the boxes that successfully produced a Rejection Signal in the past.

MTF Trading Helper & Multi AlertsHi dear fellows, I´m using this indicator for my trading, so every then and when I will publish updates on this one.
This indicator should help to identify the right trading setup. I´m using it to trade index futures and stocks.
MTF Trading Helper & Multi Alerts
Overview
This indicator provides a clear visual representation of trend direction across three timeframes. It helps traders identify trend alignment, potential reversals, and optimal entry/exit points by analyzing the relationship between different smoothed timeframes.
You can set up multiple alerts (as one alert in Tradingview)
How It Works
The indicator displays three colored circles representing the smoothed candle direction on three different timeframes:
Bottom plot represents the overall trend direction, the plot in the middle shows intermediate momentum, and the one on top captures short-term price action.
When a color change occurs, the circle appears in a darker shade to highlight the transition.
🟢 Green = Bullish - 🔴 Red = Bearish
This change can also trigger multiple alerts.
Timeframe Settings - important
Choose between two trading setups, either for:
Intraday 1-minute candles or 1h for swing trading. Set up your chart accordingly to that timeframe.
Intraday | 1Min chart candles
Swing | 1 hour chart candles
Plots
TF3 represents the overall trend direction (bottom), TF2 shows intermediate momentum (middle), and TF1 captures short-term price action (top).
Interpretation & Strategy Alerts
1. Trend Bullish (TF3 turns Green)
The higher timeframe has shifted bullish - a potential new uptrend is forming.
Example: You're watching ES-mini on the Intraday setting. TF3 turns green after being red for several days. This signals the broader trend may be shifting bullish - consider looking for long opportunities.
2. Trend Bearish (TF3 turns Red)
The higher timeframe has shifted bearish - consider protecting profits or exiting long positions.
Example: You hold a long position in Es-mini. TF3 turns red, indicating the macro trend is weakening. This is your signal to take profits or tighten stop-losses.
3. Possible Accumulation (TF3 Red + TF2 turns Green)
While the overall trend is still bearish, the medium timeframe shows buying pressure. Smart money may be accumulating - watch closely for a potential trend reversal.
Example: Es-mini has been in a downtrend (TF3 red). Suddenly TF2 turns green while TF3 remains red. This could indicate institutional buying before a reversal. Don't buy yet, but add it to your watchlist and wait for confirmation.
4. Trend Continuation (TF3 Green + TF2 turns Green)
The medium timeframe realigns with the bullish macro trend - a potential buying opportunity as momentum returns to the uptrend.
Example: Es-mini is in an uptrend (TF3 green). After a pullback, TF2 was red but now turns green again. The pullback appears to be over - this is a trend continuation signal and a potential entry point.
5. Buy the Dip (TF3 + TF2 Green + TF1 turns Green)
All timeframes are now aligned bullish. The short-term pullback is complete and price is resuming the uptrend - optimal entry for short-term trades.
Example: Es-mini is trending up (TF3 + TF2 green). A small dip caused TF1 to turn red briefly. When TF1 turns green again, all three timeframes are aligned - this is your "Buy the Dip" signal with strong confirmation.
6. Sell the Dip (TF3 + TF2 Green + TF1 turns Red)
Short-term weakness within an uptrend. This can be used to take partial profits, wait for a better entry, or trail stops tighter.
Example: You're long on ES-mini with TF3 and TF2 green. TF1 turns red, indicating short-term selling pressure. Consider taking partial profits here and wait for TF1 to turn green again (Buy the Dip) to add back to your position.
How to Use
Choose your scenario: Select "Intraday" 1min-chart for day trading or "Swing" 1h-chart for swingtrading
Enable alerts: Turn on the strategy alerts you want to receive in the settings
Wait for signals: Let the indicator notify you when conditions align
Confirm with price action: Always use additional confirmation before entering trades
Best Practices
✅ Use TF3 as your trend filter - only take longs when TF3 turns green and hold them :)
✅ Use TF2 for timing - wait for TF2 to align with TF3 for swings.
✅ Use TF2 for early entries (accumulation phase) when TF3 is still red. Watch out!
✅ Use TF1 for entries when TF3 and TF2 are green. Only buy if TF1 is red. Keep it short and sweet.
✅ Combine with support/resistance levels for better entries
✅ Use proper risk management - no indicator is 100% accurate
Disclaimer
This indicator is for educational purposes only. Past performance does not guarantee future results. Always do your own research and use proper risk management. Never risk more than you can afford to lose.

Stratégie SMC V18.2 (BTC/EUR FINAL R3 - Tendance)This strategy is an automated implementation of Smart Money Concepts (SMC), designed to operate on the Bitcoin/Euro (BTC/EUR) chart using the 15-minute Timeframe (M15).It focuses on identifying high-probability zones (Order Blocks) after a confirmed Break of Structure (BOS) and a Liquidity Sweep, utilizing an H1/EMA 200 trend filter to only execute trades in the direction of the dominant market flow.Risk management is strict: every trade uses a fixed Risk-to-Reward Ratio (R:R) of 1:3.🧱 Core Logic Components
1. Trend Filter (H1/EMA 200)Objective: To avoid counter-trend entries, which has allowed the success rate to increase to nearly $65\%$ in backtests.Mechanism: A $200$-period EMA is plotted on a higher timeframe (Default: H1/60 minutes).Long (Buy): Entry is only permitted if the current price (M15) is above the trend EMA.Short (Sell): Entry is only permitted if the current price (M15) is below the trend EMA.
2. Order Block (OB) DetectionA potential Order Block is identified on the previous candle if it is
accompanied by an inefficiency (FVG - Fair Value Gap).
3. Advanced SMC ValidationBOS (Break of Structure): A recent BOS must be confirmed by breaking the swing high/low defined by the swing length (Default: 4 M15 candles).Liquidity (Liquidity Sweep): The Order Block zone must have swept recent liquidity (defined by the Liquidity Search Length) within a certain tolerance (Default: $0.1\%$).Point of Interest: The OB must form in a premium zone (for shorts) or a discount zone (for longs) relative to the current swing range (above or below the $50\%$ level of the range).
4. Execution and Risk ManagementEntry: The trade is triggered when the price touches the active Order Block (mitigation).Stop Loss (SL): The SL is fixed at the low of the OB (for longs) or the high of the OB (for shorts).Take Profit (TP): The TP is strictly set at a level corresponding to 3 times the SL distance (R:R 1:3).Lot Sizing: The trade quantity is calculated to risk a fixed amount (Default: 2.00 Euros) per transaction, capped by a Lot Max and Lot Min defined by the user.
Input Parameters (Optimized for BTC/EUR M15)Users can adjust these parameters to modify sensitivity and risk profile. The default values are those optimized for the high-performing backtest (Profit Factor $> 3$).ParameterDescriptionDefault Value (M15)Long. Swing (BOS)Candle length used to define the swing (and thus the BOS).4Long. Recherche Liq.Number of candles to scan to confirm a liquidity sweep.7Tolérance Liq. (%)Price tolerance to validate the liquidity sweep (as a percentage of price).0.1Timeframe TendanceChart timeframe used for the EMA filter (e.g., 60 = H1).60 (H1)Longueur EMA TendancePeriods used for the trend EMA.200Lot Max (Quantité Max BTC)Maximum quantity of BTC the strategy is allowed to trade.0.01Lot Min Réel (Exigence Broker)Minimum quantity required by the broker/exchange.0.00001

LETHINH-Swing pa,smc🟦 📌 Title (English)
Swing High / Swing Low – 3-Candle Fractal (5-Bar Pivot) | Auto Alerts
⸻
🟩 📌 Short Description
A clean and reliable swing high / swing low detector based on the classic 3-candle (5-bar) fractal pivot. Automatically marks SH/SL and triggers alerts when a swing is confirmed. No repainting after confirmation.
⸻
🟧 📌 Full Description (for TradingView Publishing)
🔶 Swing High / Swing Low – 3-Candle Fractal (5-Bar Pivot)
This indicator identifies Swing Highs (SH) and Swing Lows (SL) using the classic 3-candle fractal pattern, also known as the 5-bar pivot.
It marks swing points only after full confirmation, making it highly reliable and suitable for structure-based trading.
⸻
🔶 📍 How It Works
A swing is confirmed when the center candle is higher (or lower) than the two candles on each side:
Swing High (SH)
high > high , high , high
Swing Low (SL)
low < low , low , low
The confirmation occurs after 2 right candles close, so the indicator does not repaint once a swing is identified.
⸻
🔶 📍 Key Features
• Detects clean and accurate swings
• Uses pure price action — no indicators, no lag
• Marks swing high (SH) and swing low (SL) directly on the chart
• Non-repainting after confirmation
• Works on all timeframes and all markets
• Extremely lightweight and fast
• Includes alert conditions for both SH and SL
Perfect for traders using:
• Market Structure (BOS / CHoCH)
• Order Blocks (OB)
• Smart Money Concepts (SMC)
• Liquidity hunts
• Wyckoff
• Support/Resistance
• Price Action entries
⸻
🔶 📍 Why This Indicator Is Useful
Swing points are the foundation of market structure.
Accurately detecting them helps traders:
• Identify trend shifts
• Spot BOS / CHoCH correctly
• Find key zones (OB, liquidity levels, supply/demand)
• Time entries more precisely
• Avoid fake structure breaks
This indicator ensures swings are plotted only when fully confirmed, reducing noise and confusion.
⸻
🔶 📍 Alerts
You can create alerts for both conditions:
• Swing High Confirmed
• Swing Low Confirmed
Recommended settings:
• Once per bar close
• Open-ended alert
With alerts enabled, TradingView will automatically notify you every time a new swing forms.
⸻
🔶 📍 No Repainting
Once a swing is confirmed and plotted, it will not change or disappear.
This makes the indicator reliable for real-time alerts and backtesting.
⸻
🔶 📍 Pine Script (v5)
Paste your indicator code here if you want it visible.
Or leave the code hidden if you are publishing as protected.
⸻
🔶 📍 Final Notes
• This indicator focuses on confirmation, not prediction
• It is designed for clean structure reading
• All markets supported: Forex, Crypto, Stocks, Indexes, Commodities
• Suitable for scalping, intraday, swing, and even higher-timeframe trading
If you find this tool helpful, feel free to give it a like and add it to your favorites ❤️
Your support helps me share more tools with the community!

Fibonacci Retrace + 50 EMA Hariss 369This indicator combines 3 concepts:
Fibonacci retracement zones
50 EMA trend filter
Price interaction with specific Fib zones to generate Buy/Sell signals
Let’s break everything down in simple language.
1. Fibonacci Retracement Logic
The script finds:
Most recent swing high
Most recent swing low
Using these two points, it draws Fibonacci levels:
Fibonacci Levels Used
Level Meaning Calculation
0% Swing Low recentLow
38.2% Light retracement high - (range × 0.382)
50% Mid retracement high - (range × 0.50)
61.8% Deep retracement high - (range × 0.618)
100% Swing High recentHigh
🔍 Why only these levels?
Because trading signals are generated based ONLY on:38.2%, 50%,61.8%
These 3 levels define the golden retracement zones.
2. Trend Filter — 50 EMA
A powerful rule:
Trend Up (bullish)
➡️ Price > 50 EMA
Trend Down (bearish)
➡️ Price < 50 EMA
This prevents signals against the main trend.
3. BUY Conditions (Retracement + EMA)
A BUY signal appears when:
Price is above the 50 EMA (trend is up)
Price retraces into the BUY ZONE:
🔵 BUY ZONE = between 50% and 38.2% Fibonacci i.e.,close >= Fib50 AND close <= Fib38.2
This means:
Market is trending up
Price corrected to a healthy retracement level
Buyers are stepping back in
📘 Why this zone?
This is a moderate retracement (not too shallow, not too deep).
Smart money often enters at 38.2%–50% in a strong trend.
📘 BUY Signal Appears With:
Green “BUY” label
Green arrow below the candle
4. SELL Conditions (Retracement + EMA)
A SELL signal appears when:
Price is below the 50 EMA (trend is down)
Price retraces upward into the SELL ZONE:
🔴 SELL ZONE = between 50% and 61.8% Fibonacci i.e.,close <= Fib50 AND close >= Fib61.8
This means:
Market is trending down
Price made a pullback
Sellers regain control in the golden zone
📘 Why this zone?
50–61.8 retracement is the ideal bearish pullback level.
📘 SELL Signal Appears With:
Red “SELL” label
Red arrow above the candle
5. STOP-LOSS (SL) RULES
For BUY trades,
Place SL below 61.8% level.SL = Fib 61.8%
OR
more safe:SL = swing low (Fib 0%)
For SELL trades
Place SL above 38.2% level.SL = Fib 38.2%
OR conservative:
SL = swing high (Fib 100%)
6. TAKE-PROFIT (TP) RULES
Based on common Fibonacci extensions.
BUY Trade TP Options
TP Level Meaning
TP1 Return to 38.2% Quick scalping target
TP2 Return to swing high Full trend target
TP3 Breakout above swing high Trend continuation
Practical suggestion:
TP1 = 1× risk
TP2 = 2× risk
TP3 = trailing stop
SELL Trade TP Options
TP Level Meaning
TP1 Return to 61.8% Moderate bounce
TP2 Return to swing low Trend target
TP3 Break below swing low Trend continuation
7. Recommended Trading Plan (Simple)
BUY PLAN
Price > 50 EMA (uptrend)
Enter at BUY signal in 38.2–50% zone
SL at 61.8%
TP at swing high or structure break
SELL PLAN
Price < 50 EMA (downtrend)
Enter at SELL signal in 50–61.8% zone
SL above 38.2%
TP at swing low
🟩 Summary (Very Easy to Remember)
🔵 BUY
Trend: above 50 EMA
Zone: between 50% and 38.2%
SL: below 61.8%
TP: swing high
🔴 SELL
Trend: below 50 EMA
Zone: between 50% and 61.8%
SL: above 38.2%
TP: swing low

Liquidity Structure & Sweeps [Visualized]Liquidity Structure & Sweeps | 流动性结构与猎杀
1. Design Philosophy & Logic
This indicator is designed based on Smart Money Concepts (SMC) and Market Microstructure principles. Unlike traditional indicators that rely on lagging averages or repainting fractals, this script focuses on "Objective Structure" and "Liquidity Grabs".
The core design philosophy rests on three pillars:
Zero Repainting (Real-time Integrity): We utilize a strict "Left-Side Confirmation" algorithm. A structure level is only stored in memory when the candle is fully closed (barstate.isconfirmed). This ensures that the historical signals you see are exactly what happened in real-time.
Institutional Memory (Visualized): Markets "remember" key levels. This script draws dashed lines extending from valid pivot points. These lines represent "resting liquidity" (Stop Orders). They remain on the chart until the price interacts with them.
Sweep vs. Breakout: Not all breaches are equal. We specifically look for "Sweeps" (Liquidity Grabs) — where price pierces a level but closes back inside. This is a classic sign of absorption and potential reversal, distinct from a structural breakout.
2. Key Features
Visualized Order Blocks: Automatically draws potential support (Green Dotted) and resistance (Red Dotted) lines based on fractal points.
Wick Detection: Filters out strong momentum breakouts. Signals are only generated when a specific "Wick Ratio" is met, indicating a rejection.
Clean Charts: Features a "Garbage Collection" mechanism. Once a level is swept, the line is removed, and a signal dot is placed. Old, untouched levels are automatically cycled out to prevent chart clutter.
3. How to Use
The Lines (Context):
Red Dotted Line: Buy-side Liquidity (Resistance). Expect potential shorts or breakouts here.
Green Dotted Line: Sell-side Liquidity (Support). Expect potential longs or breakdowns here.
The Signals (Action):
Red Dot (Bearish Sweep): Price spiked above a Resistance Line but closed below it. This suggests long stops were hunted, and bears are stepping in.
Green Dot (Bullish Sweep): Price spiked below a Support Line but closed above it. This suggests short stops were hunted, and bulls are stepping in.
Configuration:
Structure Length: Adjusts sensitivity. Higher values (e.g., 20-50) find major swing points; lower values (e.g., 5-10) find scalping setups.
Wick Filter %: The minimum size of the wick relative to the breakout. Increase this to filter for only the most dramatic rejections.
4. Developer Notes & Considerations
Why do lines disappear? In this logic, liquidity is treated as "Fuel". Once a level is swept (the stop orders are triggered), the fuel is consumed. Keeping the line would clutter the chart with invalid data.
Why is the dot small? The indicator is designed to be part of a toolchain, not a standalone signal. The minimalist design prevents visual interference with price action or other indicators.
1. 设计思路与核心逻辑
本指标基于 聪明钱概念 (SMC) 与 市场微观结构 原理设计。不同于依赖滞后均线或存在重绘问题的传统分形指标,本脚本专注于捕捉 “客观结构” 与 “流动性猎杀 (Liquidity Grabs)”。
核心设计哲学包含三大支柱:
零重绘 (Zero Repainting): 我们采用了严格的“左侧确认”算法。所有的结构位仅在K线完全收盘 (barstate.isconfirmed) 后才会被记录。这保证了您回测看到的信号与实盘完全一致,杜绝“未来函数”陷阱。
可视化的机构记忆: 市场是有记忆的。本脚本会从有效的波段高低点引出虚线。这些虚线代表了“沉睡的流动性”(止损盘聚集区)。它们会一直延伸,直到价格触碰它们。
区分“猎杀”与“突破”: 并不是所有的破位都是一样的。我们专注于识别“扫损(Sweep)”——即价格刺破了关键位,但收盘价收回了关键位内部。这是典型的吸筹或派发信号,与趋势延续的真突破有本质区别。
2. 主要功能
结构可视化: 自动基于分形点绘制潜在的支撑线(绿色虚线)和阻力线(红色虚线)。
插针检测: 过滤掉强势的实体突破。只有当价格出现明显的“长影线”拒绝行为时,才会触发信号。
图表自清洁: 内置“垃圾回收”机制。一旦某个关键位的流动性被猎杀(触发信号),该线条会被自动删除。过旧且未被触碰的线条也会被自动替换,保持图表整洁。
3. 使用指南
线条 (市场语境):
红色虚线: 买方流动性池(阻力位)。
绿色虚线: 卖方流动性池(支撑位)。
信号点 (交易动作):
红色圆点 (看跌猎杀): 价格刺破了红色阻力线,但收盘价回落到线下方。这暗示多头止损被触发,主力可能正在建立空单。
绿色圆点 (看涨猎杀): 价格刺破了绿色支撑线,但收盘价反弹到线上方。这暗示空头止损被触发,主力可能正在建立多单。
参数设置建议:
Structure Length (结构周期): 调整灵敏度。数值越大(如 20-50)锁定大级别波段;数值越小(如 5-10)适合短线剥头皮。
Wick Filter % (影线过滤): 设置影线占价格波动的最小比例。调大该数值可以只看最剧烈的反转信号。
4. 开发者注记与潜在考量
为什么线条会消失? 在本逻辑中,流动性被视为“燃料”。一旦发生猎杀(止损单成交),该位置的燃料即被消耗。移除线条是为了防止无效数据干扰判断。
为什么圆点设计得很小? 该指标旨在成为您交易工具链的一部分,而非唯一的决策依据。极简设计是为了避免干扰裸K形态或其他指标的观察。
===============================================================
这个脚本(我们称之为 Liq Structure Script)本质上是一个基于价格行为(Price Action)的结构猎杀探测器。
以下是详细的深度对比分析:
1. 如何使用? (实战操作手册)
不要把它当作“红灯停绿灯行”的傻瓜指标。把它当作一个**“战场地图”**。
第一阶段:观察结构 (The Setup)
图表上会自动画出 红色虚线(上方压力)和 绿色虚线(下方支撑)。
解读:告诉自己,“这里埋着很多人的止损单”。不要在这里盲目追涨杀跌。
第二阶段:等待猎杀 (The Trigger)
耐心等待价格冲向这些虚线。
关键动作:价格刺破虚线,然后迅速收回。
信号确认:虚线消失,留下一个 红点(顶部猎杀)或 绿点(底部猎杀)。
第三阶段:进场逻辑 (The Execution)
做空逻辑:出现红点 + K线留长上影线 → 说明多头试图突破失败,被主力“倒了一盆冷水”。此时可尝试做空,止损设在刚刚那个最高点上方一点点。
做多逻辑:出现绿点 + K线留长下影线 → 说明空头试图砸盘失败,被主力接住了。
传统爆量是“燃料”,Liq 脚本是“引爆点”。没有引爆点的爆量可能是空转;没有爆量的引爆点可能是假摔。Liq 脚本是一个免费、轻量级、基于K线逻辑的替代品。它不需要你买昂贵的数据服务,它利用的是“图表形态学”中的流动性共识。
结论:如何定位这个工具?
这个脚本不是“预测未来的水晶球”,而是一个**“高胜率区域提示器”**。
用它来找位置(哪里有陷阱?)。
用成交量来做确认(是不是真的有主力介入?)。
用宏观逻辑来定方向(现在该做多还是做空?)。
它是你交易工具链中负责**“微观入场时机(Timing)”**的那一环。

ORB + Fair Value Gaps (FVG/iFVG) Suite with Daily 50% MidlineA complete smart-money–focused price-action toolkit combining the New York Open Range Breakout (ORB), ICT-style Fair Value Gaps, Inverted FVGs, and a dynamic Daily 50% Midline.
Designed for traders who want a clean, fast, and highly visual way to track liquidity, imbalances, and intraday directional bias.
📌 Key Features
1. NY Session ORB (09:30–09:45 New York Time)
Automatically plots:
ORB High
ORB Low
Labels for ORB high/low
Optional 5-minute chart restriction
Lines extend forward for easy reference
Used to identify breakout conditions, liquidity sweeps, and directional bias into the morning session.
📌 2. ICT-Style Fair Value Gaps (FVGs)
Full automated detection of bullish & bearish FVGs based on the classic 3-candle displacement structure:
Bullish FVG: high < low
Bearish FVG: low > high
Each FVG is drawn as a box with:
Custom colour
Custom border style (solid, dashed, dotted)
Automatic extension to the right until filled
Optional size text showing the gap in points (font size/colour adjustable)
Adjustable max lookback for performance
📌 3. Inverted FVGs (iFVGs)
Once price fully fills an FVG, it automatically becomes an iFVG, shown with:
Custom iFVG colour
Custom border style
Extension to the right
Once price trades through the zone from the opposite side, the iFVG is considered “consumed” and:
It stops extending
And optionally auto-deletes based on user settings
This makes it easy to track meaningful imbalances that turn into liquidity pockets.
📌 4. “Show Only After ORB” Filter
Optionally hide all FVGs/iFVGs formed before the ORB completes.
This is especially useful for intraday strategies focused on NY session structure only.
📌 5. Daily 50% Midline (OHLC Midpoint)
A dynamic, always-updating midpoint of the current daily candle:
Mid = (Daily High + Daily Low) / 2
Features:
Custom colour
Dashed styling
Extends left and right as a horizontal ray
Updates live as the daily candle forms
Great for bias filters, mean reversion, and daily liquidity zones.
📌 6. Performance-Optimized (Fast!)
Built with:
Fully configurable max lookback
Memory-efficient arrays
Auto-cleaning of old FVG/iFVG objects
Lightweight daily midline recalculation
This allows extremely fast rendering even on 1-minute charts.
📌 7. Alerts
Includes a clean alert condition:
Price returned to a Fair Value Gap
Works for both bullish and bearish FVG revisits.
🎯 Who This Indicator Is For
This tool is ideal for traders who use:
ICT / SMC concepts
Liquidity-based trading
ORB strategies
Imbalance-driven price action
Intraday or NY session-focused setups
Futures, crypto, forex, and equities
🎁 Summary
This indicator gives you:
A clean ORB framework
Automatic, dynamic FVG and iFVG analysis
Real-time daily candle context
Customizable visuals
Powerful session filtering
Efficient performance
All in one clean, intuitive package built for real-time decision making.

Wyckoff Accumulation/Distribution - Enhanced by ChakraWyckoff Accumulation/Distribution - Enhanced Indicator
Overview
An advanced Pine Script v6 indicator that detects Wyckoff accumulation and distribution patterns using RSI-based trend analysis, pivot detection, and volume confirmation. This enhanced version improves upon traditional Wyckoff indicators with cleaner code, English variable names, and additional market structure signals.
Key Features
Wyckoff Phase Detection
Accumulation Phase:
SC (Selling Climax): Bottom pivot with extreme bearish RSI and high volume
AR (Automatic Rally): First bounce after selling climax
ST (Secondary Test): Retest of lows without extreme RSI
SOS (Sign of Strength): Strong bullish breakout with volume confirmation ⭐ NEW
Distribution Phase:
BC (Buying Climax): Top pivot with extreme bullish RSI and high volume
DAR (Automatic Reaction): First drop after buying climax
DST (Distribution Secondary Test): Retest of highs
SOW (Sign of Weakness): Strong bearish breakdown with volume confirmation ⭐ NEW
Market Structure Events
Spring: False breakdown (RSI crosses above lower band) with background highlight
UTAD (Upthrust After Distribution): False breakout (RSI crosses below upper band) with background highlight
Visual Features
Range Boxes: Automatically draws consolidation ranges (gray) that change color on breakout:
🟢 Green = Accumulation (bullish breakout)
🔴 Red = Distribution (bearish breakout)
Pivot Markers: Orange triangles show regular (non-Wyckoff) pivot points
Bar Coloring: Lime bars for bullish trends, purple bars for bearish trends
Color-Coded Labels: All Wyckoff events clearly marked with descriptive text
Customizable Settings
RSI Settings:
RSI Length (default: 14)
Trend Sensitivity (default: 20) - Higher values = more sideways detection
Pivot Settings:
Pivot Length (default: 5) - Controls pivot point detection sensitivity
Display Options:
Toggle range boxes on/off
Toggle regular pivot markers
Toggle bar coloring by trend
Customize label text color
Advanced Detection:
Volume Confirmation toggle - Require high volume for climax events
Volume Threshold (default: 1.5x) - Adjustable volume multiplier
Alerts
8 comprehensive alert conditions:
Selling Climax (SC)
Buying Climax (BC)
Spring detection
UTAD detection
Sign of Strength (SOS)
Sign of Weakness (SOW)
Range Breakout
Improvements Over Original
✅ Pine Script v6 (latest version)
✅ English variable names (was Turkish)
✅ Fixed DAR label bug (was showing "AR")
✅ Added SOS (Sign of Strength) detection
✅ Added SOW (Sign of Weakness) detection
✅ Optional volume confirmation toggle
✅ Organized input groups for better UX
✅ Enhanced visual options
✅ Comprehensive alert system
✅ Cleaner, more maintainable code structure
Best Use Cases
Timeframes: Works on all timeframes; best on 4H, Daily, or Weekly
Markets: Stocks, Forex, Crypto, Indices
Trading Style: Swing trading, position trading, market structure analysis
Combine With: Support/Resistance, Volume Profile, Order Flow analysis
How It Works
The indicator uses RSI to identify market states (sideways, bullish, bearish) and combines this with pivot point detection and volume analysis to identify key Wyckoff events. When price is ranging (RSI between upper/lower bands), it draws a box. On breakout, the box color changes to indicate accumulation or distribution, helping traders identify smart money positioning.
Tips for Use
Lower Trend Sensitivity (10-15) for more signals in trending markets
Higher Trend Sensitivity (25-30) for clearer signals in choppy markets
Enable Volume Confirmation in high-volume markets (stocks, major crypto)
Disable Volume Confirmation in low-volume or forex markets
Watch for Spring/UTAD events within boxes for potential reversals
Version: 1.0
Pine Script: v6
Author: Chakrapani Chittabathina

The 'Qualified' POI Scorer [PhenLabs]📊 The “Qualified” POI Scorer (Q-POI)
Version: PineScript™ v6
📌 Description
The “Qualified” POI Scorer helps intermediate traders overcome "analysis paralysis" by filtering Smart Money Concepts (SMC) structures based on their probability. Instead of flooding your chart with every possible Order Block, this script assigns a proprietary “Quality Score” (0-100) to each zone. It analyzes the strength of the displacement, the presence of imbalances (FVG), and liquidity mechanics to determine which zones are worth your attention. It is designed to clean up your charts and enforce discipline by visually fading out low-quality setups.
🚀 Points of Innovation
Dynamic “Glass UI” Transparency that automatically fades weak zones based on their score.
Proprietary Scoring Algorithm (0-100) based on three distinct institutional factors.
Visual Icon System that prints analytical context (💧— 🚀/🐌—🧱) directly on the chart.
Automated Mitigation Tracking that changes the visual state of zones after they are tested.
Displacement Velocity calculation using ATR to verify institutional intent.
🔧 Core Components
Liquidity Sweep Engine: Detects if a pivot point grabbed liquidity from the previous X bars before reversing.
FVG Validator: Checks if the move away from the zone created a valid Fair Value Gap.
Momentum Scorer: Calculates the size of the displacement candle relative to the Average True Range (ATR).
🔥 Key Features
Quality Filtering: Automatically hides or dims zones that score below 50 (user configurable).
State Management: Zones turn grey when mitigated and delete themselves when invalidated.
Visual Scorecard: Displays the exact numeric score on the zone for quick decision-making.
Time-Decay Logic: Keeps the chart clean by managing the lifespan of old zones.
🎨 Visualization
High Score Zones (80-100): Display as bright, semi-solid boxes indicating high probability.
Medium Score Zones (50-79): Display as translucent “glass” boxes.
Low Score Zones (<50): Display as faint “ghost” boxes or are completely hidden.
Rocket Icon (🚀): Indicates high momentum displacement.
Snail Icon (🐌): Indicates low momentum displacement.
Drop Icon (💧): Indicates the zone swept liquidity.
Brick Icon (🧱): Indicates the zone is supported by an FVG.
📖 Usage Guidelines
Swing Structure Length (Default: 5): Controls the sensitivity of the pivot detection; lower numbers create more zones, higher numbers find major swing points.
ATR Length (Default: 14): Determines the lookback period for calculating relative momentum.
Minimum Quality Score (Default: 50): The threshold for which zones are considered “valid” enough to be fully visible.
Bullish/Bearish Colors: Fully customizable colors that adapt their own transparency based on the score.
Show Weak Zones (Default: False): Toggles the visibility of zones that failed the quality check.
✅ Best Use Cases
Filtering noise during high-volatility sessions by focusing only on Score 80+ zones.
Confirming trend continuation entries by looking for the Rocket (🚀) momentum icon.
Avoiding “stale” zones by ignoring any box that has turned grey (Mitigated).
⚠️ Limitations
The indicator is reactive to closed candles and cannot predict news-driven spikes.
Scoring is based on technical structure and does not account for fundamental drivers.
In extremely choppy markets, the ATR filter may produce lower scores due to lack of displacement.
💡 What Makes This Unique
It transforms subjective SMC analysis into an objective, quantifiable score.
The visual hierarchy allows traders to assess chart quality in milliseconds without reading data.
It integrates three separate SMC concepts (Liquidity, Imbalance, Structure) into a single tool.
🔬 How It Works
Step 1: The script identifies a Swing High or Low based on your length input.
Step 2: It looks backward to see if that swing swept liquidity, and looks forward to check for an FVG and displacement.
Step 3: It calculates a weighted score (30pts for Sweep, 30pts for FVG, 40pts for Momentum).
Step 4: It draws the zone with a transparency level designated by the score and appends the relevant icons.
💡 Note:
For the best results, use this indicator on the timeframe you execute trades on (e.g., 15m or 1h). Do not use it to find entries on the 1m chart if your analysis is based on the 4h chart.

SCOB Pattern with ERC & AlertsSingle Candle Block (SC0B) consists of a single candle appearing at a significant price level, indicating a confirmed reversal in price direction from that particular area of interest.
SCOB is primarily used to confirm and execute trades.
Using a single candle block to enter a trade minimizes risk and maximizes reward.
Single bullish candle block?
1st candle closes at bullish point of interest with a short or long wick.
2nd candle sweeps the low of previous(1st) candle and closes above the low of previous candle.
3rd candle closes above the high of 2nd candle.
How to trade with Scob bullish.
To Trade using Bullish SCOB you have to wait for price to come down and test the single candle order block.
When price tests the SCOB you can directly execute a buy trade or for a precise entry you can wait for a market structure shift in lower time frame.
Scob discount is the opposite of price increase.
This strategy should only be used when price "sweeps through key lever, liquidity, imbalance, poi htf areas.
This indicator will add a filter to help you reduce signal noise.
Use the "Use engulfing candle to test" function to filter the 3rd candle.
Only search for Scob if the 3rd candle is an Engulfing candle.
The logic for finding Engulfing candles can be changed based on the "% maximum wick length" option. The default is that the candle wick is 25% of the total candle wick length.
You can also use the alert function when Scob appears
With Smart money concept, no strategy is perfect in trading, so you should not risk too much of your capital on this strategy.
To be safer, always remember to use stop loss for every trade.

COT Net Positions OTCCOT Net Positions Indicator Description
This is a TradingView Pine Script indicator that displays Commitment of Traders (COT) data for any trading instrument.
What it does:
Fetches COT Data - Uses the TradingView COT library to retrieve official CFTC (Commodity Futures Trading Commission) data for the current symbol
Calculates Net Positions for three trader categories:
Commercial (Blue) - Large hedging institutions; represents institutional long/short positioning
Non-Commercial (Yellow) - Large speculators and hedge funds; often considered "smart money"
Retail (Red) - Small individual traders; often considered contrarian indicators
Net Position Calculation - For each category:
Takes Long Positions minus Short Positions
Plots the result on a separate panel below the price chart
Special Symbol Handling - Includes custom mappings for specific commodities:
Copper (HG) → CFTC code 085692
Brazilian Real (LBR) → CFTC code 058644
Use Cases:
Market Bias Detection - See if institutions are mostly long or short
Contrarian Trading - When retail traders are extremely positioned one way, often the market reverses
Trend Confirmation - Non-commercial positioning often aligns with established trends
Support/Resistance - Extreme COT positions can signal market turning points


Advanced Triple Strategy ScalperHere are the three scalping strategies presented in the video "3 Scalping Strategies That Work Every Day (Backtested & Proven)" by Asia Forex Mentor – Ezekiel Chew:
### Scalper’s Trend Filter (Triple EMA)
This strategy uses three EMAs (25, 50, 100) on the 5-minute chart to filter high-probability trades aligned with momentum .
- Only trade when all three EMAs are angled in the same direction and clearly separated (no crossing or tangling) .
- Enter when price pulls back toward the 25 or 50 EMA and then bounces back toward the 25 EMA, but do not enter if price closes below the 100 EMA .
- Set stop-loss just below the 50 EMA or swing low and aim for a risk-to-reward ratio of 1:1.5 .
### Flip Zone Trap (Reversal Catching)
This method identifies precise reversal moments where market structure shifts from weakness to strength .
- Use the 15-min chart to locate key support or resistance zones where price previously reacted .
- Wait for price to stop making lower lows and begin making higher highs (or vice versa for shorts); confirm with a trendline break AND follow-through (higher lows & highs within 5-7 candles) .
- Use confirmation candles (bullish engulfing, pin bar rejection) at the zone before entry .
### Liquidity Shift Trigger (Smart Money Trap)
This system leverages institutional stop hunts and liquidity sweeps at key zones for sniper entries .
- Start with a 15-min chart to identify structure breaks and points of interest (order blocks, flip zones, demand zones) .
- Drop to 1-min chart and wait for price to enter the refined zone and sweep liquidity (sharp wick/spike below/above key level) .
- Once liquidity is swept, wait for a clean structure shift (break of most recent internal high or low) within 5–6 candles—if confirmed, refine entry to the candle that caused the break and enter when price returns to that candle with a strong reaction .
***
### Practical Application
- These strategies are systematic, rule-based, and designed to cut out fake moves, avoid early stop-outs, and align entries with momentum and institutional activity .
- Perfect for short timeframes and volatile pairs like XAUUSD, especially if paired with additional confirmation from other technical analysis tools .
All three strategies emphasize filtering noise, waiting for momentum/trend confirmation, and avoiding impulsive entries—key principles for consistent scalping success

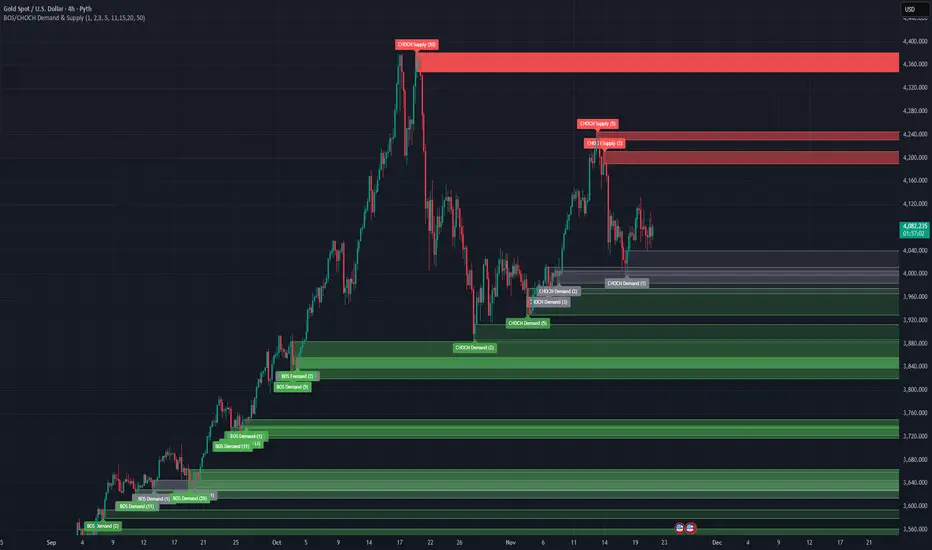
BOS/CHOCH Demand & SupplyThis indicator automatically identifies and plots Supply and Demand zones based on Smart Money Concepts (SMC) methodology. It detects structural breaks in price action and marks the origin zones that initiated these moves.
How It Works (Technical Methodology)
1. Swing Point Detection
The indicator uses Pine Script's ta.pivothigh() and ta.pivotlow() functions to identify swing highs and lows. Users can input multiple lookback periods (e.g., 1, 2, 3, 5, 11, 15, 20) to detect structure across different timeframe perspectives simultaneously.
2. Break of Structure (BOS) Detection
A Bullish BOS is confirmed when:
Current candle closes above the last swing high
Previous candle's high was still below that swing high
The current swing high is higher than the previous swing high (trend continuation)
A Bearish BOS is confirmed when:
Current candle closes below the last swing low
Previous candle's low was still above that swing low
The current swing low is lower than the previous swing low (trend continuation)
3. Change of Character (CHOCH) Detection
A Bullish CHOCH is confirmed when:
Price breaks above the last swing high
But that swing high was lower than the previous swing high (potential reversal signal)
A Bearish CHOCH is confirmed when:
Price breaks below the last swing low
But that swing low was higher than the previous swing low (potential reversal signal)
4. Inducement / Liquidity Grab Filter (Optional)
When enabled, zones are only drawn if the swing point that created them first grabbed liquidity from the previous swing:
For Demand zones: The swing low must have traded below the previous swing low before the bullish break
For Supply zones: The swing high must have traded above the previous swing high before the bearish break
This filter helps identify higher-probability zones where stop-losses were likely triggered before the move.
5. Zone Construction
Demand Zone (Bullish):
Top boundary: max(open, close) of the swing low candle
Bottom boundary: low of the swing low candle
Supply Zone (Bearish):
Top boundary: high of the swing high candle
Bottom boundary: min(open, close) of the swing high candle
This captures the candle body-to-wick range where institutional orders likely reside.
6. Zone Lifecycle Management
Active Zone: Displayed in green (demand) or red (supply)
Mitigated Zone: When price touches the zone but doesn't break it, the zone turns gray (indicating partial fill)
Broken Zone: When price fully breaks through the zone, it is automatically deleted from the chart
How to Use
Demand Zones (Green): Look for long entries when price returns to these zones. The zone represents where buying pressure previously overcame selling.
Supply Zones (Red): Look for short entries when price returns to these zones. The zone represents where selling pressure previously overcame buying.
BOS Zones: Indicate trend continuation - trade in the direction of the break.
CHOCH Zones: Indicate potential reversal - these are early warning signals of trend change.
Enable "Require Inducement" for higher-quality setups where liquidity was grabbed before the structural break.
Multi-Lookback Periods: Using multiple values helps identify zones across different structural levels. Smaller values catch minor structure; larger values catch major structure.
Disclaimer
This indicator is a technical analysis tool and should be used in conjunction with other forms of analysis. Past performance does not guarantee future results. Always use proper risk management.
3 day look backThis script is designed to help traders visually compare daily liquidity behavior between two correlated assets — for example, the Nasdaq (NQ) and the S&P500 (ES).
It plots each day’s High and Low, aligned from Midnight to Midnight, with a clean session structure. This makes it easier to identify:
SMT (Smart Money Technique) divergences
liquidity grabs
daily highs/lows sweeps
relative strength/weakness between assets
intraday bias shifts based on daily structure
What the script does
Reconstructs each trading day from 00:00 to 00:00, regardless of session irregularities.
Plots the High and Low of every completed day.
Allows users to display as many past days as they want (custom “look-back” parameter).
Automatically merges the weekend with Friday for assets where Saturday/Sunday sessions are fragmented.
Includes a manual midnight offset (–12h to +12h) to fix timezone inconsistencies on TradingView charts (common on futures).
Optional real-time lines for the current day.
No excessive right-side extensions for clean intraday reading.
Why this is useful
When comparing paired assets (e.g., NQ vs ES), liquidity behavior is often different.
This script makes it easy to spot:
when one asset makes a new daily high while the other doesn’t
asymmetrical liquidity sweeps
SMT-based divergence setups
liquidity grabs at daily levels
intraday directional bias shifts
About the other indicators shown on the chart
In the example chart, two additional indicators are used only for clarity and structure:
Day of the Week — displays the weekday on each session for easier orientation.
Vertical Line Timeline — draws a clean separator line between days.
These indicators are not required for this High/Low script to work.
They simply help visually organize sessions and make daily structure easier to read when comparing two assets side by side.
How to use
Open two assets (e.g., NQ1! and ES1!) side by side.
Apply this script on both charts.
Set the same timeframe.
Choose how many days back you want to visualize (look-back parameter).
Observe how each asset interacts with its daily High/Low.
Look for SMT divergences and liquidity-based setups.
Main features
Midnight-to-Midnight alignment
Weekend fusion
Manual offset for perfect timing
Adjustable daily look-back
Clean daily liquidity
Optional dynamic daily levels
Ideal for SMT/liquidity-based intraday trading

Cjack COT IndexHere's the updated description with the formula and additional context:
---
**Cjack COT Index - Commitment of Traders Positioning Indicator**
This indicator transforms raw Commitment of Traders (COT) data into normalized 0-100 index values, making it easy to identify extreme positioning across different trader categories.
**How It Works:**
The indicator calculates a min-max normalized index for three trader groups over your chosen lookback period (default 26 weeks):
- **Large Speculators** (Non-commercial positions) - typically trend followers
- **Small Speculators** (Non-reportable positions) - retail traders
- **Commercial Hedgers** - producers and consumers hedging business risk
The normalization formula is: **Index = (Current Position - Minimum Position) / (Maximum Position - Minimum Position) × 100**
This calculation shows where current net positioning sits between the minimum and maximum levels observed in the lookback window. A reading of 100 means current positioning equals the maximum net long over that period, 0 equals the minimum (most net short), and 50 is the midpoint of the range.
**Important:** The lookback period critically affects index readings - shorter lookbacks (13-26 weeks) make the index more sensitive to recent extremes, while longer lookbacks (52-78 weeks) provide broader historical context and identify truly exceptional positioning. Min-max normalization is essential because it makes positioning comparable across different contracts and time periods, regardless of the absolute size of positions.
**What It's Good For:**
The indicator excels at identifying **crowded trades** and potential reversals by tracking contrarian setups where commercials (smart money) position opposite to speculators. Background highlighting automatically flags:
- **Long setups** (green): Commercials heavily long while speculators are heavily short
- **Short setups** (red): Commercials heavily short while speculators are heavily long
The "Shift Index" option (enabled by default) displays last week's tradeable COT data aligned with current price action, ensuring you're working with actionable information since COT reports publish with a delay.
Works on weekly timeframes and below for commodities and futures with available COT data.

Liquidity Sweep + BOS Retest System — Prop Firm Edition🟦 Liquidity Sweep + BOS Retest System — Prop Firm Edition
A High-Probability Smart Money Strategy Built for NQ, ES, and Funding Accounts
🚀 Overview
The Liquidity Sweep + BOS Retest System (Prop Firm Edition) is a precision-engineered SMC strategy built specifically for prop firm traders. It mirrors institutional liquidity behavior and combines it with strict account-safe entry rules to help traders pass and maintain funding accounts with consistency.
Unlike typical indicators, this system waits for three confirmations — liquidity sweep, displacement, and a clean retest — before executing any trade. Every component is optimized for low drawdown, high R:R, and prop-firm-approved risk management.
Whether you’re trading Apex, TakeProfitTrader, FFF, or OneUp Trader, this system gives you a powerful mechanical framework that keeps you within rules while identifying the market’s highest-probability reversal zones.
🔥 Key Features
1. Liquidity Sweep Detection (Stop Hunt Logic)
Automatically identifies when price clears a previous swing high/low with a sweep confirmation candle.
✔ Filters noise
✔ Eliminates early entries
✔ Locks onto true liquidity grabs
2. Automatic Break of Structure (BOS) Confirmation
Price must show true displacement by breaking structure opposite the sweep direction.
✔ Confirms momentum shift
✔ Removes fake reversals
✔ Ensures institutional intent
3. Precision Retest Entry Model
The strategy enters only when price retests the BOS level at premium/discount pricing.
✔ Zero chasing
✔ Extremely tight stop loss placement
✔ Prop-firm-friendly controlled risk
4. Built-In Risk & Trade Management
SL set at swept liquidity
TP set by user-defined R:R multiplier
Optional session filter (NY Open by default)
One trade at a time (no pyramiding)
Automatically resets logic after each trade
This prevents overtrading — the #1 cause of evaluation and account breaches.
5. Designed for Prop Firm Futures Trading
This script is optimized for:
Trailing/static drawdown accounts
Micro contract precision
Funding evaluations
Low-risk, high-probability setups
Structured, rule-based execution
It reduces randomness and emotional trading by automating the highest-quality SMC sequence.
🎯 The Trading Model Behind the System
Step 1 — Liquidity Sweep
Price must take out a recent high/low and close back inside structure.
This confirms stop-hunting behavior and marks the beginning of a potential reversal.
Step 2 — BOS (Break of Structure)
Price must break the opposite side swing with a displacement candle. This validates a directional shift.
Step 3 — Retest Entry
The system waits for price to retrace into the BOS level and signal continuation.
This creates optimal R:R entry with minimal drawdown.
📈 Best Markets
NQ (NASDAQ Futures) – Highly recommended
ES, YM, RTY
Gold (XAUUSD)
FX majors
Crypto (with high volatility)
Works best on 1m, 2m, 5m, or 15m depending on your trading style.
🧠 Why Traders Love This System
✔ No signals until all confirmations align
✔ Reduces overtrading and emotional decisions
✔ Follows market structure instead of random indicators
✔ Perfect for maintaining long-term funded accounts
✔ Built around institutional-grade concepts
✔ Makes your trading consistent, calm, and rules-based
⚙️ Recommended Settings
Session: 06:30–08:00 MST (NY Open)
R:R: 1.5R – 3R
Contracts: Start with 1–2 micros
Markets: NQ for best structure & volume
📦 What’s Included
Complete strategy logic
All plots, labels, sweep markers & BOS alerts
BOS retest entry automation
Session filtering
Stop loss & take profit system
Full SMC logic pipeline
🏁 Summary
The Liquidity Sweep + BOS Retest System is a complete, prop-firm-ready, structure-based strategy that automates one of the cleanest and most reliable SMC entry models. It is designed to keep you safe, consistent, and rule-compliant while capturing premium institutional setups.
If you want to trade with confidence, discipline, and prop-firm precision — this system is for you.
Good Luck -BG

ICS🏛️ Institutional Confluence Suite (ICS) Indicator
The Institutional Confluence Suite is a powerful and highly customizable TradingView indicator built to help traders identify key institutional trading concepts across multiple timeframes. It visualizes essential market components like Market Structures (MS), Order Blocks (OB)/Breaker Blocks (BB), Liquidity Zones, and Volume Profile, providing a confluence of institutional price action data.
📈 Key Features & Components
1. Market Structures (MS)
Purpose: Automatically identifies and labels shifts in market trends (Market Structure Shift, MSS) and continuations (Break of Structure, BOS).
Timeframe Detection: You can select detection across Short Term, Intermediate Term, or Long Term swings to match your trading horizon.
Visualization: Plots colored lines (Bullish: Teal, Bearish: Red) to mark the structures and optional text labels (BOS/MSS) for clear identification.
2. Order & Breaker Blocks (OB/BB)
Purpose: Detects and projects potential Supply and Demand zones based on recent price action that led to a swing high or low.
Block Types: Distinguishes between standard Order Blocks and Breaker Blocks (OBs that fail to hold and are traded through, often serving as support/resistance in the opposite direction).
Customization:
Detection Term: Adjusts sensitivity (Short, Intermediate, Long Term).
Display Limit: Sets the maximum number of recent Bullish and Bearish blocks to display.
Price Reference: Option to use the Candle Body (Open/Close) or Candle Wicks (High/Low) to define the block boundaries.
Visualization: Displays blocks as colored boxes (Bullish: Green, Bearish: Red) extending into the future, with a dotted line marking the 50% equilibrium level. Breaker Blocks are indicated by a change in color/line style upon being broken.
3. Buyside & Sellside Liquidity (BSL/SSL)
Purpose: Highlights areas where retail stops/limit orders are likely clustered, often represented by a series of relatively equal highs (Buyside Liquidity) or lows (Sellside Liquidity).
Detection Term: Adjustable sensitivity (Short, Intermediate, Long Term).
Margin: Uses a margin (derived from ATR) to group similar swing points into a single liquidity zone.
Visualization: Plots a line and text label marking the swing point, and a box indicating the clustered liquidity zone.
4. Liquidity Voids (LV) / Fair Value Gaps (FVG)
Purpose: Identifies areas where price moved sharply and inefficiency was created, often referred to as Fair Value Gaps or Imbalances. These are price ranges where minimal trading volume occurred.
Threshold: Uses a multiplier applied to the 200-period ATR to filter for significant gaps.
Mode: Can be set to Present (only show voids near the current price) or Historical (show all detected voids).
Visualization: Fills the price gap with colored boxes (Bullish/Bearish zones), often segmented to represent the price delivery across the gap.
5. Enhanced Liquidity Detection
Purpose: A complementary feature that uses volume and price action to highlight areas of high liquidity turnover, potentially indicating stronger Support and Resistance zones.
Calculation: Utilizes a volume-weighted approach to color-grade liquidity zones based on their significance.
Visualization: Plots shaded boxes (gradient-colored) around swing highs/lows, with text displaying the normalized volume strength.
6. Swing Highs/Lows
Purpose: Directly marks the price points identified as Swing Highs and Swing Lows based on the lookback periods.
Timeframe Detection: Can be enabled for Short Term, Intermediate Term, or Long Term swings.
Visualization: Plots a small colored dot/label (e.g., "⦁") at the swing point.
This indicator is an invaluable tool for traders employing ICT (Inner Circle Trader), Smart Money Concepts (SMC), or general price action strategies, as it automatically aggregates and displays these critical structural and liquidity elements.

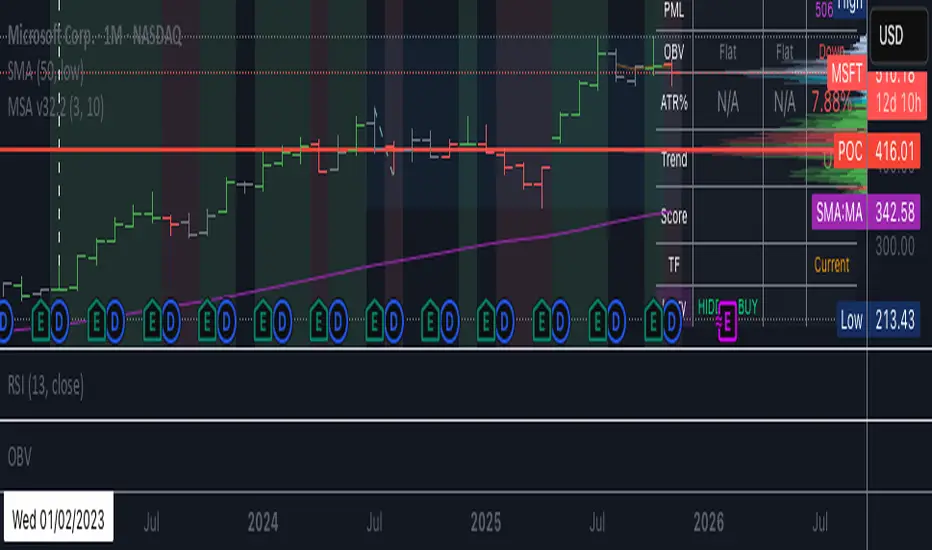
BC_Monthly Strength Armor [xAI] - v32.2 MTF LOCKED + SCORE FIXED🛡️ **Monthly Strength Armor - v32.2**
**Multi-Timeframe Institutional Edge Indicator**
🔥 **Detects smart money moves** using:
- **Monthly Range Position (Score 0–100)**
- **Higher High/Low Trend Structure (Daily/Weekly/Monthly)**
- **OBV Trend Lock (100% consistent)**
- **Larry Williams OHLC Institutional Patterns (Daily)**
📊 **MTF Table (locked values — no flicker)**
| Daily | Weekly | Monthly |
|-------|--------|---------|
| OBV | Trend | Score |
| ATR% | Larry | PMH/PML |
🎯 **Confluence Alerts**
- **3-TF Bullish / Bearish**
- **ULTRA BUY/SELL** (all TFs aligned)
- **Larry Institutional Buying/Selling**
✅ **No repaint | No warnings | Live-ready**
Built for **NVDA, MSFT, URA, QQQ, SPY**
*By @TedPrime x Grok @ xAI*